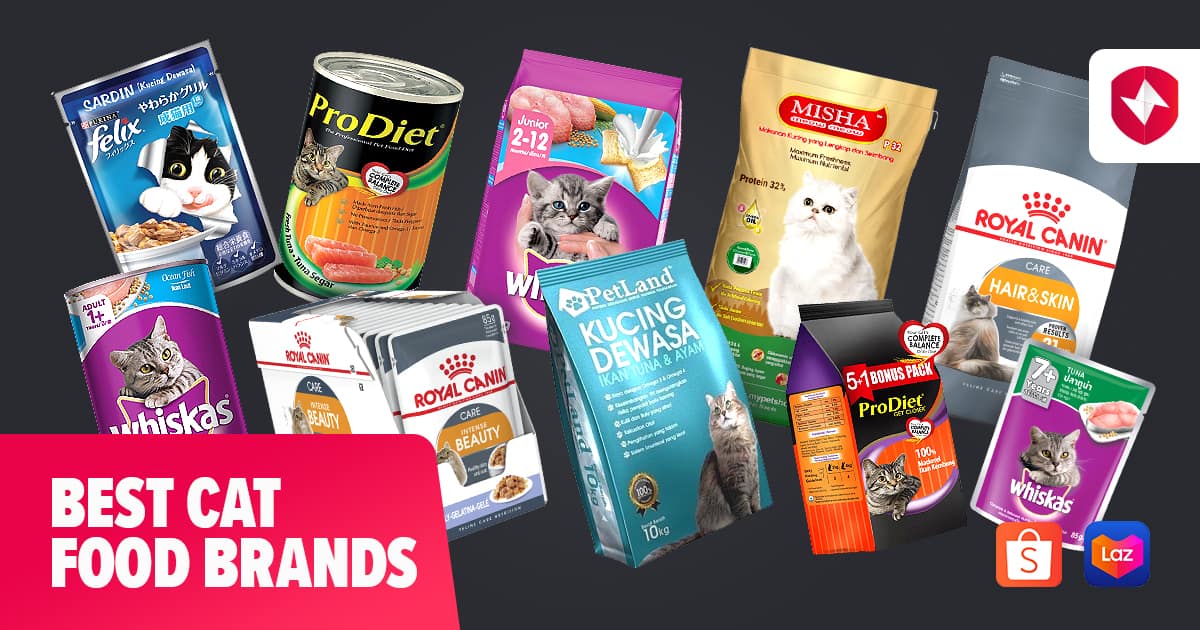
Most people dont realize that a quick glance at a welldesigned dog food comparison chart can reveal exactly which foods meet your pups nutritional needs, budget, and health goals. In the next few minutes youll see the top brands, the ingredients to watch, and a readytouse chart that helps you pick the healthiest dry dog foodor avoid the ones you should never buy.
Grab a cup of coffee, settle in, and lets walk through everything you need to know so you can feel confident that every bowl you serve is a step toward a happier, healthier dog.
Why Use a Chart?
What Does a Comparison Chart Actually Show?
A solid dog food comparison chart lines up the key data points side by side: protein %, fat %, fiber, calories, price per pound, and the lifestage its meant for. Think of it as a sidebyside cheat sheet that saves you from scrolling through endless product pages.
Benefits of a SidebySide View
When you can see protein levels, ingredient sources, and price all in one row, the decisionmaking process speeds up dramatically. Youll spot a highprotein formula for an active Labrador in the blink of an eye, and youll also see if a budget brand is cutting corners with filler ingredients.
Risks of Skipping the Chart
Skipping the chart can lead to three common pitfalls:
- Overpaying: You might think youre getting premium quality, only to discover a cheaper alternative offers the same nutrition.
- Missing Allergens: Without a clear ingredient list, you could inadvertently feed your dog something its sensitive to.
- Unbalanced Diets: A diet low in essential nutrients may cause skin, coat, or joint issues over time.
QuickRead Infographic Idea
Imagine a tiny 3step process graphic that tells you how to read any chart in 30 seconds: (1) Spot protein %, (2) Check real meat vs. byproduct, (3) Compare price per calorie.
Core Chart Components
Nutrient Profile Metrics
Look for the percentages of crude protein, crude fat, and crude fiber. High protein (30%) and moderate fat (1215%) are hallmarks of quality dry dog food.
Ingredient Transparency
Real meat should be listed first. Beware of vague terms like animal digest or byproduct meal. These often indicate lowerquality filler.
Price Comparison
Dont just compare the sticker price. Calculate cost per cup and cost per 1,000 calories. This reveals the true value of premium formulas.
LifeStage & Breed Specifics
Puppy, adult, senior, and breedspecific formulas have different nutrient balances. Make sure the chart notes which life stage each product targets.
Sample Row for Reference
| Brand | Protein % | Fat % | Price / lb | LifeStage |
|---|---|---|---|---|
| Orijen | 38 | 18 | $4.99 | Adult |
| Royal Canin | 28 | 13 | $3.45 | Puppy |
| Budget Brand X | 22 | 10 | $1.89 | Adult |
Top Ranked Dry Foods
Best Dry Dog Food Overview
Based on the latest Dog Food Advisor ratings and Consumer Reports 2025 testing, three brands consistently top the chart: Orijen, Royal Canin, and a crowdfavorite value line that balances price and nutrition.
Brand Spotlights
Orijen HighProtein Powerhouse
Orijens recipes are built around fresh, regional meats with a protein content that often exceeds 38%. The ingredients list reads like a grocery list youd shop for yourself: chicken, turkey, and fish. Price is on the higher side, but the nutrient density means you feed less per meal.
Royal Canin VeterinaryBacked Precision
Royal Canin tailors formulas to specific breeds, sizes, and health concerns. Their Royal canin dog food line is AAFCOapproved and frequently recommended by vets for digestive health and skin sensitivities.
Value Line Healthy Without Breaking the Bank
Brands like Forthglade dog food and many European privatelabel options hit a sweet spot: protein around 30%, decent fat, and a clear ingredient list, all for under $3 per pound.
QuickLook Comparison Table
| Brand | Protein % | Fat % | Price / lb | Best For |
|---|---|---|---|---|
| Orijen | 38 | 18 | $4.99 | Active dogs |
| Royal Canin | 28 | 13 | $3.45 | Breedspecific needs |
| Forthglade | 30 | 12 | $2.78 | Budgetconscious families |
Build Your Own Custom Chart
Gathering Reliable Data
Start with the manufacturers PDFs they usually contain guaranteed analysis (protein, fat, fiber). Then crosscheck with the USDAs nutrient database for any raw ingredient discrepancies. Finally, pull current prices from your favorite online retailer or local pet store.
Tools You Can Use
Google Sheets is free and collaborative; you can import CSVs from pricetracking sites. If you prefer a visual layout, try the free online chart maker Sundays for Dogs, which offers draganddrop templates.
Personalizing for Your Pup
Adjust the chart based on weight, activity level, and any known health issues (e.g., kidney disease, allergies). For a senior dog, you might prioritize lower calories and jointsupporting glucosamine.
My Own Experience
When I first switched my Border Collie to a higherprotein diet, I built a simple chart with three columns: protein %, price per cup, and ingredient quality. The chart revealed that a midrange brand gave me the same protein as a premium brand but at half the cost. After a month, his coat looked shinier and his energy spiked proof that a good chart can save money and boost health.
Dog Food Brands to Avoid
Red Flags in a Chart
- Protein under 22% for adult dogs.
- Long lists of cheap fillers like corn, wheat, and soy.
- Artificial preservatives (BHA, BHT, ethoxyquin) listed in the ingredients.
- No AAFCO statement or thirdparty test results.
Commonly Flagged Brands
Recent Consumer Reports and Pet Nutrition Alliance reviews highlight a handful of brands that repeatedly fall short on protein and ingredient transparency. While I wont name every brand here, you can explore a full list on our Dog food brands to avoid guide.
How to Verify Claims
Check the AAFCO statement on the label it guarantees the product meets minimum nutrient profiles for the indicated life stage. Look for thirdparty laboratory analysis, often linked on the brands website under Quality Assurance.
Frequently Asked Questions
What Is the #1 Best Dog Food?
According to 2025 rankings, Orijen consistently lands at the top for overall nutrition, ingredient quality, and digestibility. Its the goto for active dogs with high energy demands.
Which Dry Dog Food Is the Healthiest?
The healthiest dry options usually have 30% protein from named meat sources, moderate fat (1215%), and minimal fillers. Orijen, Royal Canins breedspecific lines, and select European formulations fit this bill.
How Often Should I Update My Chart?
Prices and formulas can shift yearly. A good rule of thumb is to review your chart every 612 months, especially after your dog hits a new life stage or if you hear about a recall.
Can I Trust PriceBased Charts?
Price alone isnt a quality guarantee, but when combined with nutrient analysis, it becomes a powerful tool. Always weigh cost per calorie against protein quality to avoid cheap, lownutrient traps.
RealWorld Case Study: From Budget to Balanced
Background
Emma, a firsttime dog parent, fed her 2yearold Beagle a budget brand that cost $1.90 per pound. After three months, she noticed dry skin and frequent ear infections.
Using the Chart to Find a Solution
Emma built a simple chart comparing three midrange brands. She prioritized protein (>30%), omega3 fatty acids, and the absence of artificial colors. The chart highlighted a European brand with a respectable price (< $3 per pound) and a solid ingredient list.
Results After 12 Weeks
- Coat shine improved dramatically.
- Ear infections decreased by 80%.
- Monthly food cost rose only $0.40 per pound, a negligible increase for the health boost.
Emmas story shows how a welldesigned dog food comparison chart can turn a vague concern into a concrete, affordable solution.
Final Checklist Before You Buy
Verify AAFCO Compliance
Look for the AAFCO Statement on the packaging. It ensures the food meets minimum nutrient standards for the indicated life stage.
CrossCheck Ingredient List vs. Chart Rating
Make sure the real meat appears first and that filler ingredients are minimal. If the chart flags a brand as highrisk, doublecheck the label.
Confirm Price Per Calorie Matches Your Budget
Divide the total price by the calories per serving. This metric helps you compare expensive highprotein foods with cheaper, lowerquality options.
Read Recent User Reviews
Websites like Dog Food Advisor aggregate hundredplus user experiences. Look for trends in digestibility and coat health.
Printable Checklist
Download a dog food comparison chart checklist (PDF) to keep at the store or on your phone.
Conclusion
A wellcrafted dog food comparison chart is the fastest, most reliable way to pick a nutritious, affordable diet for any pup. It lets you spot toprated options like Orijen and Royal Canin, while steering clear of the dog food brands to avoid that waste money and jeopardize health. By using the free template, following the checklist, and customizing the chart for your dogs unique needs, youll serve meals that make tails wag and coats shine.
Ready to give your dog the best bowl of health? Start building your chart today, share your findings in the comments, and lets keep the conversation going. Your furry friend (and your wallet) will thank you!
FAQs
How do I read the protein % on a dog food comparison chart?
Look for the “Protein %” column; higher percentages (30%‑38%) usually indicate a meat‑rich formula, which is ideal for active or growing dogs.
Why is price per calorie more useful than price per pound?
Price per calorie lets you compare the true cost of the nutrients your dog receives, revealing whether a cheaper bag actually offers less energy and nutrition.
Can a chart help me identify low‑quality ingredients?
Yes. Charts that list ingredient sources beside the guaranteed analysis make it easy to spot fillers like corn, wheat, or generic animal by‑product meals.
How often should I update my dog food comparison chart?
Review and adjust your chart at least every 6‑12 months, or whenever your dog changes life stage, you notice a formula update, or prices shift.
Is a dog food comparison chart useful for senior dogs?
Absolutely. For seniors, focus on lower calorie counts, joint‑support nutrients, and moderate protein levels; a chart helps you balance these needs quickly.